Introduction.
Since their adoption by Twitter in July of 2009, hashtags have become a defining feature of the platform. They have helped raise awareness of social issues, sparked political debate, and brought people who share common interests together. They have also spread to other social media platforms – namely Instagram in 2011, Facebook and Google+ in 2013 – and are now used by more than 85% of the top 50 websites by traffic.
Just as interestingly, they provide valuable metadata about the topic of tweets, which makes them the perfect tool to understand how Twitter trends spread and how they relate to real-world events. This is precisely the point of this article: using a dataset containing 1% of the public tweets of 2017, we will first give an overview of hashtags for the year 2017, look for patterns in the way they are used, and then focus on two major hashtags of 2017 – #NotMyPresident and #BalanceTonPorc – to try and identify the key actors and events which helped them spread.
An overview of hashtags.
Let's start with an overview of hashtags for the year 2017. Our dataset contains around 15 million different hashtags, only 38% of which were used more than once (keep in mind that our dataset is a 1% sample of tweets, so those hashtags might have been used a few hundred times in reality). More surprisingly, less than 1% of hashtags were used more than 250 times.
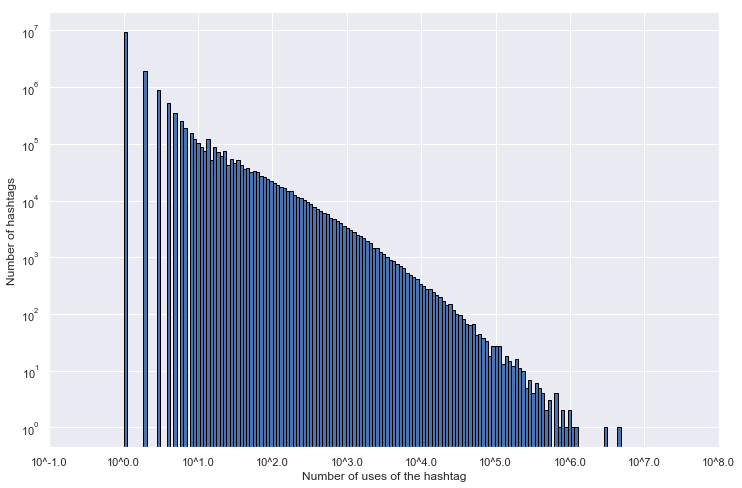
If we look at the distribution from Figure 1, which uses a logarithmic scale on both axes, we can see that the number of uses of hashtags follows a power law almost perfectly (the noise in the beginning can be explained by the sampling, which penalizes hashtags with few uses). In particular, we can see that the top 1% of hashtags accounts for more than 75% of all uses of hashtags on Twitter.
Besides the number of uses of a hashtag, which quantifies how much people participate to a trend, another interesting metric is the number of times people have seen the hashtag on their Twitter feed, which instead quantifies the impact of the trend. This metric, which we call the exposure of the hashtag, can be approximated by the taking all the tweets and retweets which use the hashtag, and summing the number of followers of their authors.
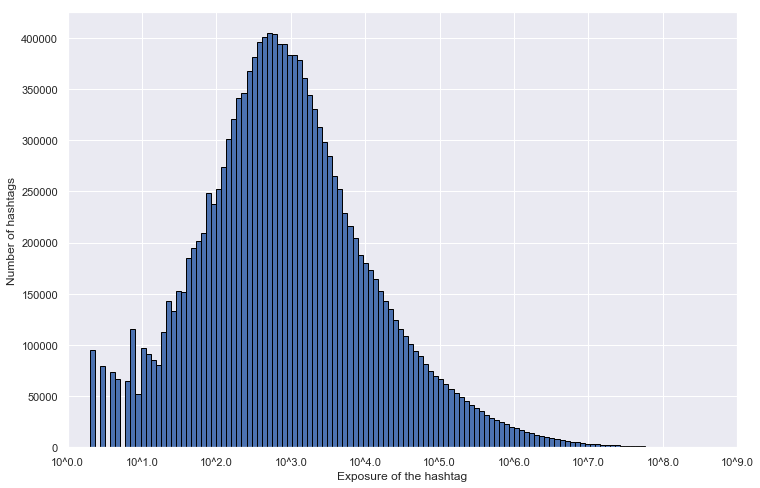
If we look at the distribution from Figure 2, we can see that the exposure of hashtags follows a log-normal distribution, which is often found when modeling human interactions. In particular, we can see that the majority of hashtags in our sample are seen between 100 and 10,000 times, while a little less than 25,000 hashtags are seen more than ten million times.
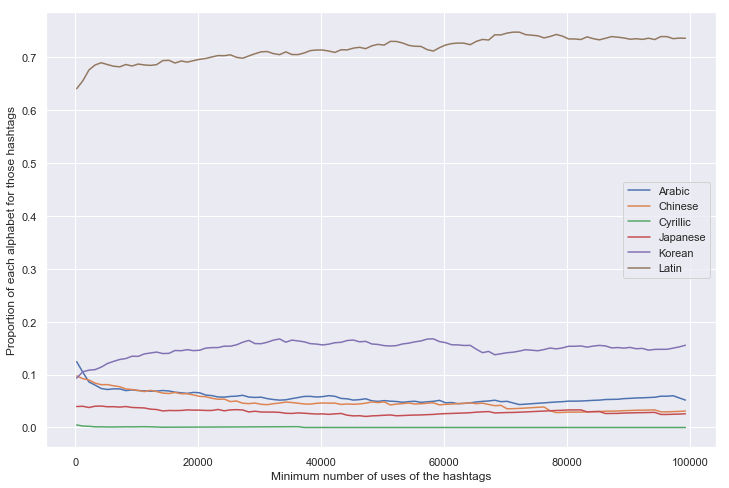
By looking at which alphabet is used in hashtags, we can find some interesting figures regarding the parts of the world which use Twitter. As shown on Figure 3, the majority of hashtags of 2017 are written in the Latin alphabet, but a non-negligible fraction of them is written in Korean, Chinese, and Arabic.
We might wonder whether this repartition of alphabets changes when we only consider popular hashtags. Figure 4 gives us the answer: the proportion of hashtags in each alphabet is almost constant, no matter the popularity of the hashtags that we consider. This would imply, in particular, that the mechanisms behind the popularization of hashtags does not depend on the language or the country.
Finding impactful hashtags.
Using the two metrics that we described above – number of uses of the hashtag and exposition of the hashtag – we would now like to identify some of the hashtags which had the biggest impact in 2017. Let's start by looking at Figure 5, which shows the 10 most used hashtags of 2017.
There are several intersting things to notice here. First of all, we can see that 6 of the 10 most used hashtags are related to music, and K-pop in particular. The hashtags #방탄소년단, #BTS and #BTSBBMAs are a reference to BTS, a South Korean boy band, and #GOT7 also refers to a Korean band – and not the seventh season of Game of Thrones.
The high number of uses of #BBMAs, #BTSBBMAs, #MTVHottest and #PremiosMTVMiaw can easily be explained by the fact that they correspond to three TV shows or contests – the Billboard Music Awards, MTV's Hottest Summer Superstar and the MTV Millenial Awards – which ask the audience to vote for their favorite artists using hashtags. To confirm this, Figure 6 shows the number of uses of the #BTS and #BTSBBMAs hashtags for each day of 2017.
#BTS and #BBBTSBBMAs in 2017.The first thing to notice in this graph is that #BTS is used steadily troughout the year 2017, but the hashtag peaked – to ten times its regular use – between the 21st and 24th of May, coinciding with the BBMA ceremony. We can then see that #BTSBBMAs started trending at the beginning of May, most likely in response to the tweet below, and was used heavily during the entire month up until the day of the ceremony.
[투표] 2017 빌보드 뮤직 어워드 투표가 곧 시작됩니다! #방탄소년단 #BTS 🔥
— BTS_official (@bts_bighit) 1 mai 2017
Vote @BTS_twt for #BBMAs Top Social Artist ✔️
(https://t.co/s8h6yTxEux)
Let's look at the other hashtags. After checking the tweets for #izmirescort and #bucaescort, it turns out that these two hashtags are used by bots to promote an escort service in Buca, Turkey. The bots are still active to this day, as can be seen in the tweet below, and are easily recognizable by the fact that they have no followers and almost no followings.
ceevreeleerinee uymaak icin keendileerini yoontaanlaar tukeenip gideerleer #izmireſčort #ałsancakeſčort pic.twitter.com/YAUnesQUMo
— gorkem aydogan (@gorkemaydogan2) 16 décembre 2018
This shows a flaw in our metric: even though those hashtags had abolutely no impact on Twitter in 2017, the fact that they were used a lot by bots pushed them on top of our list. Let's try a different approach: we define the exposure per tweet as the ratio between the exposure of the hashtag and the number of times it was used. It should intuitively give us the hashtags which were seen by many people but were not used a lot, which should in particular avoid bots – as they would have a near-zero ratio. To be precise, if a tweet has a ratio greater than the median number of followers of every Twitter user – 190 in our dataset – then it is likely that it was written by a human.
Figure 7 shows the top 10 hashtags of 2017 according to this new metric. The first thing to notice is that we have achieved our initial goal: there are no more bot-generated hashtags in this list. This metric, however, doesn't seem to capture “impact” in the general sense. This is explained by the fact that, when people feel concerned about a hashtag, they write tweets with it; but in that case our ratio decreases.
So, actually, this metric allows us to find “hashtag fiascos”, i.e. hashtags that were tweeted by accounts with a lot of followers – usually corporate accounts – but didn't catch on. This is the case, for instance, of the #FeelTrueEmojiPower hashtag, which was used by Microsoft in November 017 to promote the Xbox, or the #NDTVTopStories hashtag used by Indian news channel NDTV.
Patterns in the use of hashtags.
Now that we have seen a few ways to identify “important” hashtags of 2017, we would like to try and understand the patterns that govern their use on Twitter. We have already taken a look at several hashtags, some of which were used at a constant rate throughout the year – e.g. #BTS – and others whose use was localized in time, usually around the broadcast of a TV show or contest.
Our dataset essentially shows three possible patterns for hashtags:
- They are used at a constant rate throughout the year, usually for thematic hashtags like
#food; - Or they exhibit “spikes” of activity, and then slowly fade away, which happens in the case of real-world events – say the World Cup – or TV shows which use hashtags to engage with their audience;
- Or they start becoming popular after some event and grow continuously from there, which happened with
#NotMyPresidentor#MeToofor instance.
We would now like to quantify which of these patterns hashtags follow, so that we could group those which behave similarly. A useful tool for this task is Dynamic time warping, which is a measure of similarity for two temporal sequences which may vary in speed. We can then cluster hashtags with this measure, for instance using K-means.
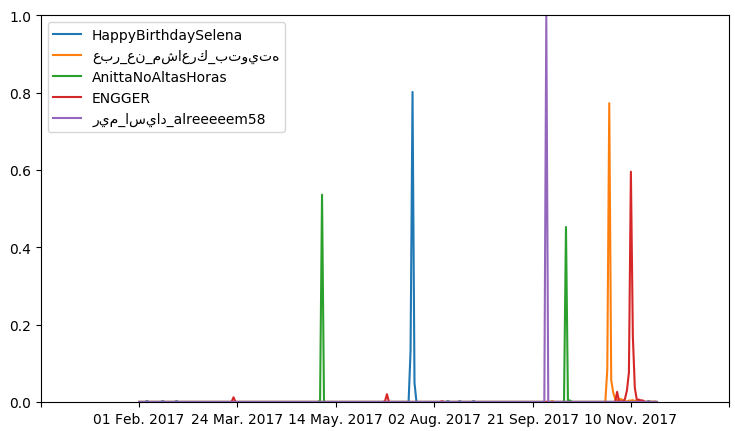
Figure 8 shows one resulting cluster, which is formed of five hashtags which exhibit a similar behaviour: they have all been used a lot for a single day, and have then faded away immediately afterwards. One downside of this method is that, even though it was able to cluster hashtags which share this behavior, it struggled to categorize hashtags which a spread throughout the year.
We have also seen that some hashtags are “linked”, either because they correspond to the same real-world event or because they are two ways to express the same idea. This prompts another question: can we detect co-occuring hashtags, i.e. hashtags which trend simultaneously? One way to do this is to cluster hashtags once again, but this time with the euclidian distance between the number of time they are used each day instead. This gives the results from Figure 9, which show the usage of #MissUniverse, #Philippines and #Thailand in November 2017. They all trended at the same time around the 26th, which makes sense given that the Miss Universe 2017 contest was held that day, and that Miss Philippines and Miss Thailand were among the contestants.
#MissUniverse, #Philippines and #Thailand.Now that we have looked at hashtags in general, we would like to dig deeper into the chronology and influence mechanisms behind two hashtags which gained significant traction in 2017: #NotMyPresident and #BalanceTonPorc, the French counterpart of #MeToo.
#NotMyPresident, from Election Day to Presidents' Day.
On the 9th of November 2016 at 2:50 AM Eastern Time, after several months of heated political campain, Democratic candidate Donald Trump became the new president-elect of the United States. This came as a surprise to most of the American public, as both mainstream media and polls assumed that he would loose the election to Hillary Clinton – his opponent in the race. In his speech that night, he asked Americans to unite.
“Now it is time for Americans to bind the wounds of division, […] It is time for us to become together as one united people. […] I pledge to every citizen of our land that I will be president for all Americans.”
But what happened was quite the opposite: soon after the election, a growing number of Americans started expressing their indignation at the results, and rallied under the slogan “Not My President”. Consequently, the #NotMyPresident hashtag started trending on Twitter, and it is now being used regularly as a way to disagree with Trump's policies. In this section, we will look at the details of hashtag's chronology, and will try to understand who influenced the “Not My President” movement.
Interestingly enough, we can find some occurences of #NotMyPresident long before the 2016 presidential election. The slogan emerged during the George W. Bush presidency, and gained traction in 2003 after the invasion of Iraq by a US-led coalition. The first use of the slogan on Twitter can be traced back to February 2009 – at the beginning of the Obama presidency – with the following tweet from user @RevGreeblie, in reaction to his visit to Downtown Fort Myers.
Pobama got talk to 1500 assets slobbers in FL. Sounds like he's at an old fashioned revival or a rock concert. ugh. #notmypresident
— Zombie Abe 💀 Lincoln (@RevGreeblie) 10 février 2009
As shown on Figure 10, the hashtag caught on in the middle of 2010, and was used steadly – around a few hundred times a month – until October 2016 for everything from disagreeing with Obama's policies or protesting against the possible election of Ursula von der Leyen as President of Germany to condemning the visit of the the Russian May Victory parade by the President of the Czech Republic.
#NotMyPresident until Nov. 2016.But let's go back to our main topic: the use of #NotMyPresident as a way to protest against the election of Donald Trump. If we zoom in on November 2016, as shown on Figure 11, we get a better sense of the chronology behind the spread of the hashtag. Around 3:00am CET (which translates to somewhere between 7:00pm and 10:00pm in the United States depending on the timezone), we start seeing a rise in the number of tweets which use #NotMyPresident. This perfectly matches the time, during Election Night, when predictions started to favor Donald Trump over Hillary Clinton.
#NotMyPresident around Election Day 2016.The hashtag then remains used consistently during the week, although a little bit less than at the peak of the hashtag on November 9th. Looking closely, we also notice a periodic decrease in the number of uses of the hashtag which happens every day at around 11am CET. This corresponds to the middle of the night in the United States (between 2am and 5am depending on the timezone), which confirms that people tweet less during the night.
If we take a look at individual tweets around this time, we can see that some people predicted what would happen a few days before, like Twitter user @WesStLixx.
Me the next two days....#notmypresident https://t.co/ULiXSE9wYo
— Wesley Castelhano (@WesStLixx) 8 novembre 2016
But a vast majority of Americans did not see it coming, and started to realize what was about to happen at around 5:00am CET (which translates to the middle of Election Night).
Goddamn. Goddamn. Goddamn. I don't understand. What kind of world are we living in? #brexit and now this? #burnitdown #notmypresident
— stephan!e lee (@stef_lee) 9 novembre 2016
Understanding the propagation of influence for #NotMyPresident.
We would now like to find out which Twitter users had the most influence in the “Not My President” movement, either because they wrote popular tweets about it or because they were mentioned a lot in those tweets. To this end, we will build an influence graph whose nodes are all the users of Twitter who were involved with the hashtag, and where we add an edge from user A to user B every time A retweeted or mentioned A in a tweet with the hashtag #NotMyPresident.
We then use the PageRank algorithm, which Google uses to evaluate the importance of webpages, to give each user of the graph an influence score. Intuitively, this score will be higher for users which have been retweeted or mentionned by many other important users of the hashtag. We finally isolate the 20 users with the biggest influence score, which gives us Figure 12.
#NotMyPresident according to their PageRank scores.Without surprise, @realDonaldTrump has the biggest influence score, as he was mentionned in many of the #NotMyPresident tweets. It is interesting to notice that news outlets were also involved in the movement, either because they tweeted about it or because they were mentioned a lot. Some good example are @CNN and @FoxNews, who never tweeted with #NotMyPresident directly, but were mentioned by many protesters who partly blamed them for the results of the election.
A Lot of my professional colleagues & I have NOT watched @CNN or @MSNBC (NEVER @FoxNews) since Nov 8. They are despicable #NotMyPresident https://t.co/wrep8heNe3
— vonPinto (@vonPinto1) 4 décembre 2016
We also notice a few liberal journalists among the most influent users, e.g. @KeithOlbermann and @JoyAnnReid, as well as left-wing politicians like @HillaryClinton or @SenSanders.
To better understand the propagation of influence between users of the hashtag, we also plotted the influence graph on Figure 13. Since we can't possibly represent all Twitter users on the same graph, we restricted the visualization to the most influential users and their neighbords. Notice that the size of a user is proportional to its influence score.
#NotMyPresident.#BalanceTonPorc, the French counterpart of #MeToo.
Another interesting hashtag to study is #BalanceTonPorc, the French counterpart of #MeToo movement. #MeToo spread virally in October 2017, in the wake of the sexual abuse allegations against Hollywood producer Harvey Weinstein, as a way to denounce the prevalence of sexual assault and harassment against woman. The phrase had actually been used as early as 2006 by Tarana Burke, an American civil rights activist, but it only came to the attention of the general public after the following tweet by American actress Alyssa Milano.
If you’ve been sexually harassed or assaulted write ‘me too’ as a reply to this tweet. pic.twitter.com/k2oeCiUf9n
— Alyssa Milano (@Alyssa_Milano) 15 octobre 2017
To understand the chronology of #BalanceTonPorc, we will start by looking at the number of daily uses of the hashtag on Twitter during the end of 2017 on Figure 14.
#BalanceTonPorc during the end of 2017.According to our data, #BalanceTonPorc was actually coined before the rise of #MeToo by Sandra Muller – a.k.a. @LettreAudio, a French journalist living in New York, with the tweet below. The hashtag spread rapidly, reaching its peak on the 15th of October – the same day as #MeToo – which prompted many French woman to share their own experience of sexual violences.
#balancetonporc !! toi aussi raconte en donnant le nom et les détails un harcèlent sexuel que tu as connu dans ton boulot. Je vous attends
— Sandra Muller (@LettreAudio) 13 octobre 2017Understanding the propagation of influence for #BalanceTonPorc.
Using the same method as for #NotMyPresident, we can try to pinpoint the Twitter users who had the most influence on #BalanceTonPorc. We first build an influene graph for the hashtag, which can be seen on Figure 16, and we use the PageRank algorithm to give each user an influence score. Figure 15 gives a list of the 20 most influential users according to this score.
#BalanceTonPorc according to their PageRank scores.We first notice that @LettreAudio, the originator of the hashtag, is among the most influential users. Like with #NotMyPresident, there are also a majority of news outlets – e.g. @libe, @lemondefr or @BFMTV – which wrote articles and tweets about the movement. Below is one such tweet, by @libe, which was retweeted more than 300 times and features the cover of the October 17th issue of Liberation – which was dedicated to the hashtag.
A la une de Libé demain: «Porcs sur le gril». #balancetonporc https://t.co/QQHXBAdO8n pic.twitter.com/FEobzpnT5R
— Libération (@libe) 16 octobre 2017
The list of influential users also features French journalist @CaronAymericoff, who received backlash after a tweet on October 15th which criticized the hashtag for being speciesist, as well as French politician @LydiaGuirous.
Dommage d'avoir choisi un hashtag spéciste. Il aurait été préférable de choisir #balancetonharceleur ou #balancetonweinstein https://t.co/qzt8ulUkSH
— AymericCaronOfficiel (@CaronAymericoff) 15 octobre 2017
#BalanceTonPorc, obtained using PageRank.About this project.
This analysis of Twitter hashtags was carried out as part of the Applied Data Analysis (CS-401) class at EPFL by Pierre Oechsel, Emiljano Gjiriti and Romain Liautaud. The source code of this page can be found here, and the code supporting our analysis can be found there.